Stop Arguing With Your AI. Start Showing It What You See.
Imagine trying to teach someone to cook over the phone.
You’re walking them through your grandmother’s pasta recipe—the one with the garlic that needs to be just golden, not brown. You describe every step perfectly. The timing. The technique. The little flip of the wrist when you toss the noodles.
And then they say: “It’s burning. What do I do?”
Here’s the thing: you can’t help them. Not really. Because you can’t see the pan. You can’t see how high the flame is. You can’t see that they accidentally grabbed the chili flakes instead of oregano. All you have is their panicked description and your best guess about what might be going wrong.
This, my friend, is exactly what happens when you ask Claude Code to fix a bug.
(Stay with me here.)
.
.
.
The Merry-Go-Round Nobody Enjoys
You’ve been on this ride before. I know you have.
You describe the bug to Claude. Carefully. Thoroughly. You even add screenshots and error messages because you’re a good communicator, dammit.
Claude proposes a fix.
You try it.
It doesn’t work.
So you describe the bug again—this time with more adjectives and maybe a few capitalized words for emphasis. Claude proposes a slightly different fix. Still broken. You rephrase. Claude tries another angle. Round and round we go.
This is the debugging merry-go-round, and nobody buys tickets to this ride on purpose.
The instinct—the very human instinct—is to blame the AI.
- “Claude isn’t smart enough for this.”
- “Maybe I need a different model.”
- “Why can’t it just SEE what’s happening?”
That last one?
That’s actually the right question.
Just not in the way you think.
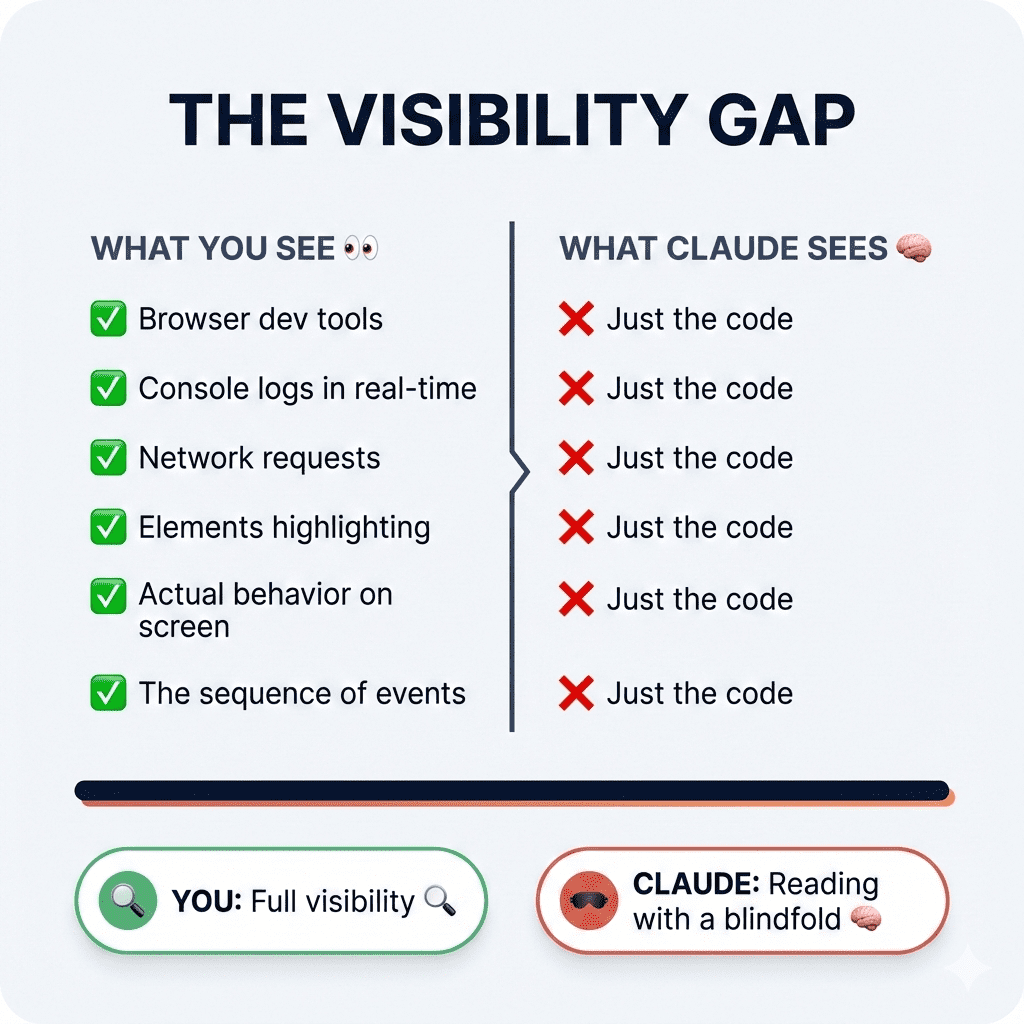
Here’s what I’ve learned after spending more time than I’d like to admit arguing with AI about bugs: Claude almost never fails because it lacks intelligence. It fails because it lacks visibility.
Think about what you have access to when you’re debugging. Browser dev tools. Console logs scrolling in real-time. Network requests you can inspect. Elements that highlight when you hover. The actual, living, breathing behavior playing out on your screen.
What does Claude have?
The code. Just the code.
That’s it.
You’re asking a brilliant chef to fix your burning pasta—but they can only read the recipe card. They can’t see the flame. They can’t smell the smoke. They’re working with incomplete information and filling in the gaps with educated guesses.
Sometimes those guesses are right. (Claude is genuinely brilliant at guessing.)
Most of the time? Merry-go-round.
.
.
.
The Two Bugs That Break AI Every Time
After countless Claude Code debugging sessions—some triumphant, many humbling—I’ve noticed two categories that consistently send AI spinning:
The Invisible State Bugs
React’s useEffect dependencies.
Race conditions. Stale closures. Data that shapeshifts mid-lifecycle like some kind of JavaScript werewolf. These bugs are invisible in the code itself. You can stare at the component for hours (ask me how I know) and see nothing wrong. The bug only reveals itself at runtime—in the sequence of events, the timing of updates, the order of renders.
It’s happening in dimensions Claude can’t perceive.
The “Wrong Address” Bugs
CSS being overridden by inline JavaScript. WordPress functions receiving unexpected null values from somewhere upstream. Error messages that point to line 7374 of a core file—not your code, but code three function calls removed from the actual problem.
The error exists.
But the source? Hidden in cascading calls, plugin interactions, systems talking to systems.
Claude can’t solve either category by reading code alone.
So what do we do?
We give Claude eyes.
(I told you to stay with me. Here’s where it gets good.)
.
.
.
Method 1: Turn Invisible Data Into Evidence Claude Can Actually See
Let me walk you through a real example.
Because theory is nice, but showing you what this looks like in practice? That’s the good stuff.
I had a Products Browser component. Simple filtering and search functionality—the kind of thing you build in an afternoon and then spend three days debugging because life is like that sometimes.
Each control worked beautifully in isolation:
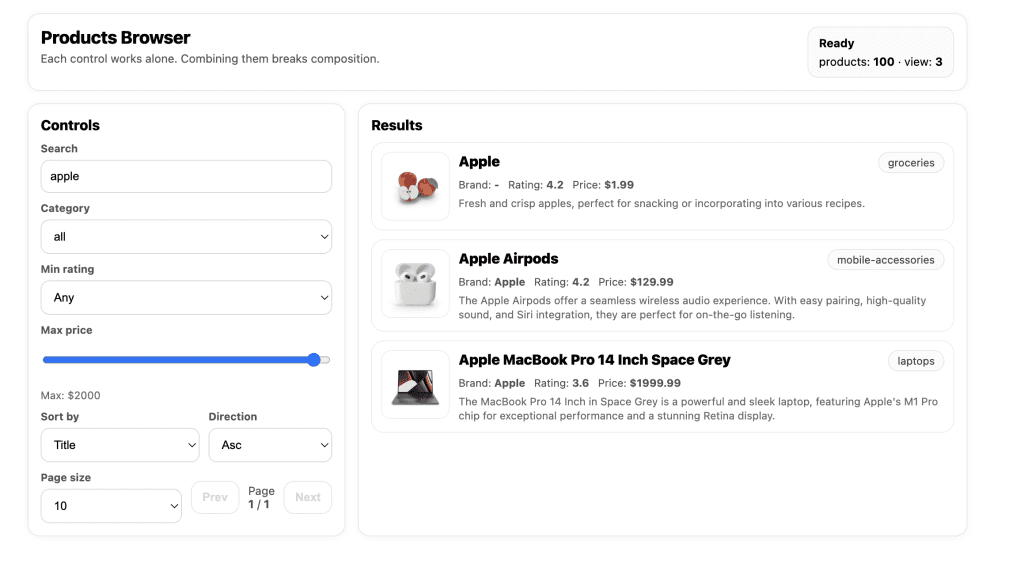
Search for “apple” → Three results. Beautiful.
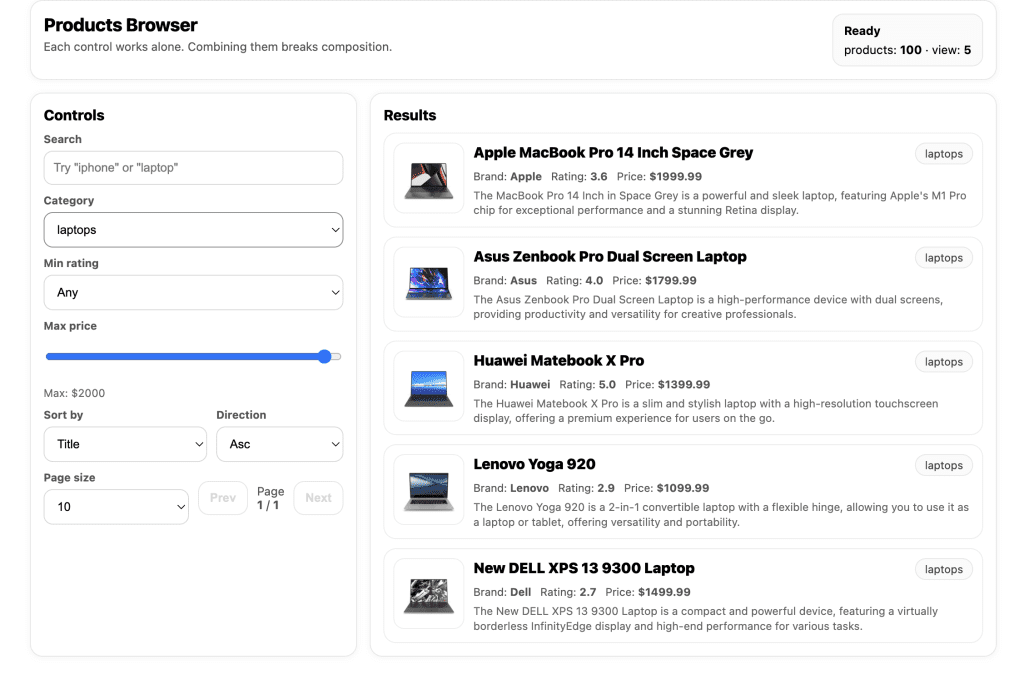
Filter by “laptops” → Five results. Chef’s kiss.
But combine them?
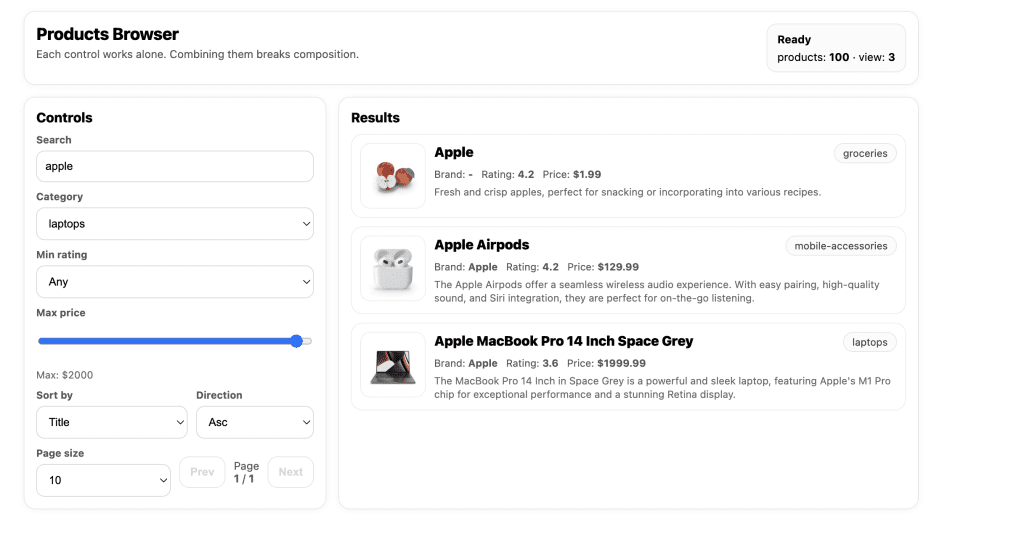
Search “apple” + category “laptops” → Broken. The filter gets completely ignored, like I never selected it at all.
Classic React hook dependency bug.
If you’re experienced with React, you spot this pattern in your sleep. But if you’re newer to the framework—or if you vibe-coded this component and touched a dozen files before realizing something broke—you’re stuck waiting for Claude to get lucky.
I spent three rounds asking Claude to fix it. Each fix addressed a different theoretical cause. None worked.
That’s when I stopped arguing and started instrumenting.
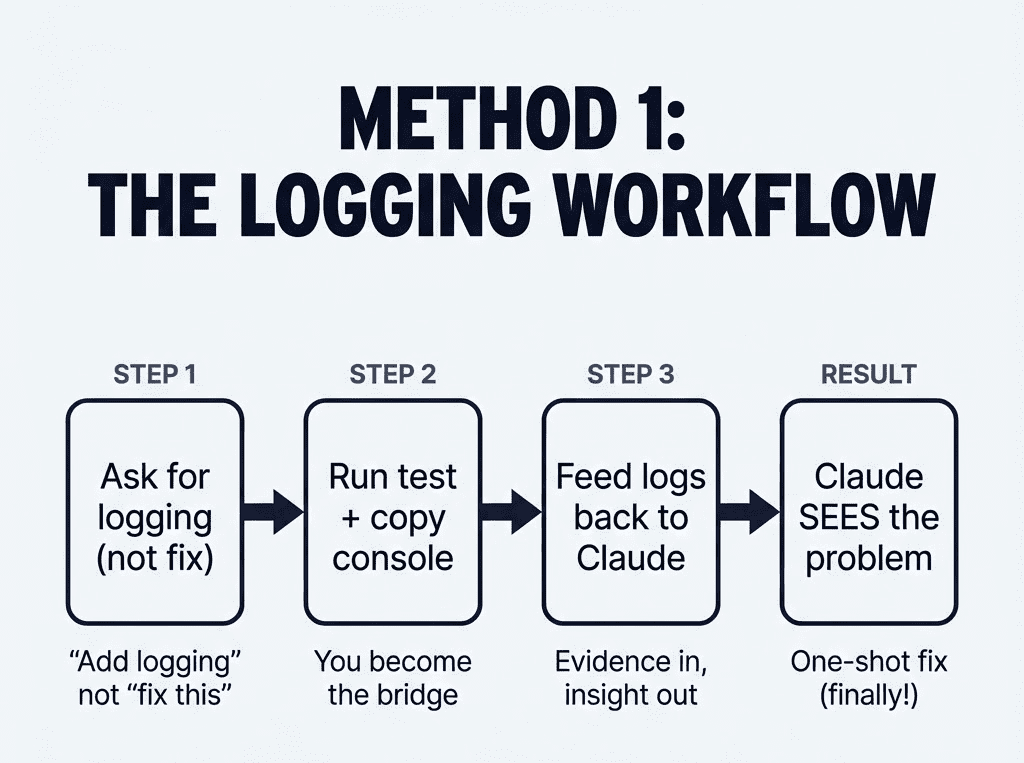
Step 1: Ask Claude to Add Logging (Not Fixes)
Instead of another “please fix this” prompt, I asked Claude to help me see what was happening:

Notice what I didn’t say: “Fix this bug.”
What I said: “Add logging to track data changes.”
This is the mindset shift that changes everything.
Claude added console.log statements to every useEffect that touched the view state:
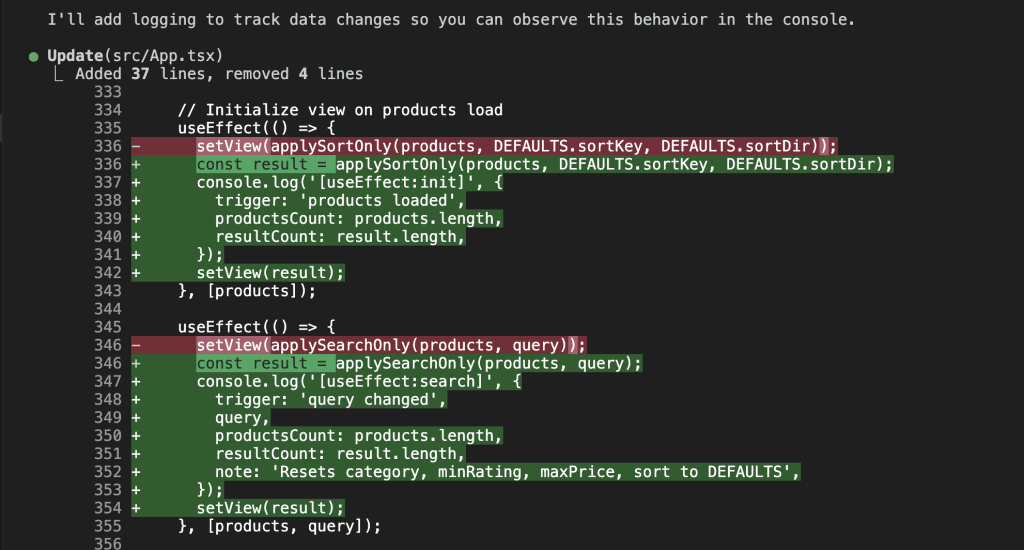
Each log captured which effect triggered, what the current values were, and what got computed. Basically, Claude created a running transcript of everything happening inside my component’s brain.
Step 2: Run the Test and Capture What You See
I opened the browser, selected “laptops” from the category filter, then typed “apple” in the search box.
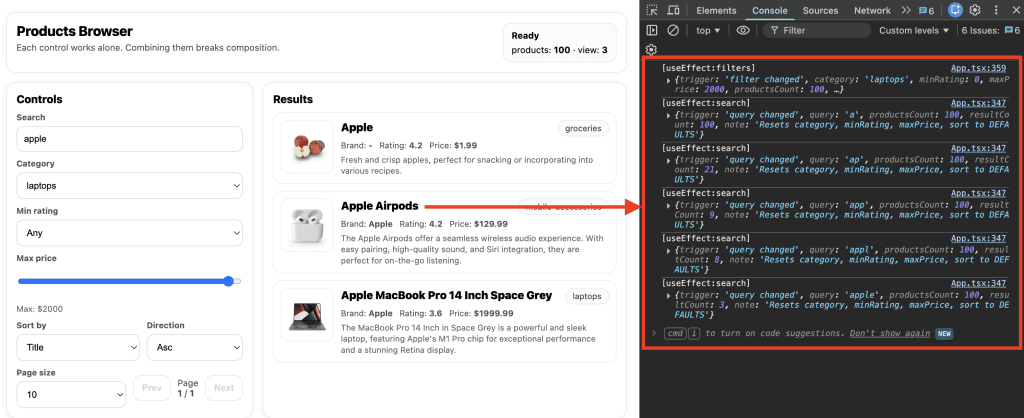
The console lit up like a Christmas tree of evidence.
Step 3: Feed the Logs Back to Claude
Here’s where the magic happens. I copied that console output—all of it—and pasted it directly into Claude:
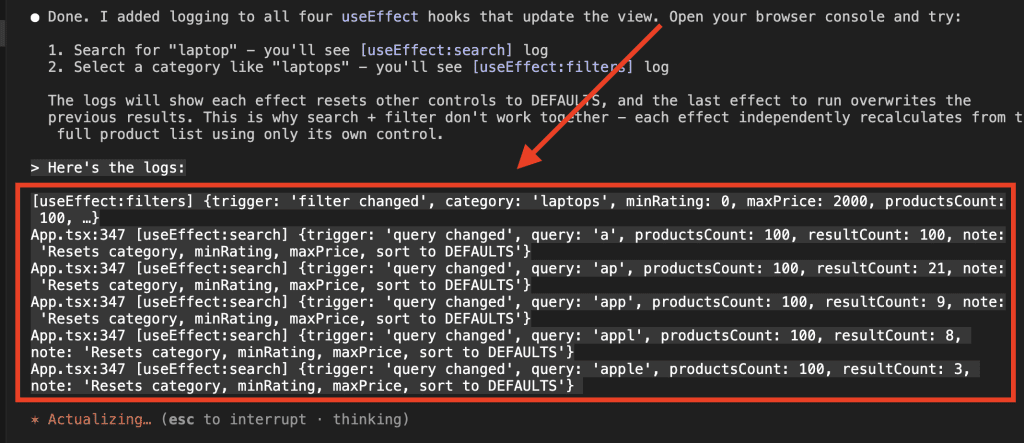
And Claude? Claude saw everything:
Claude found the bug immediately.
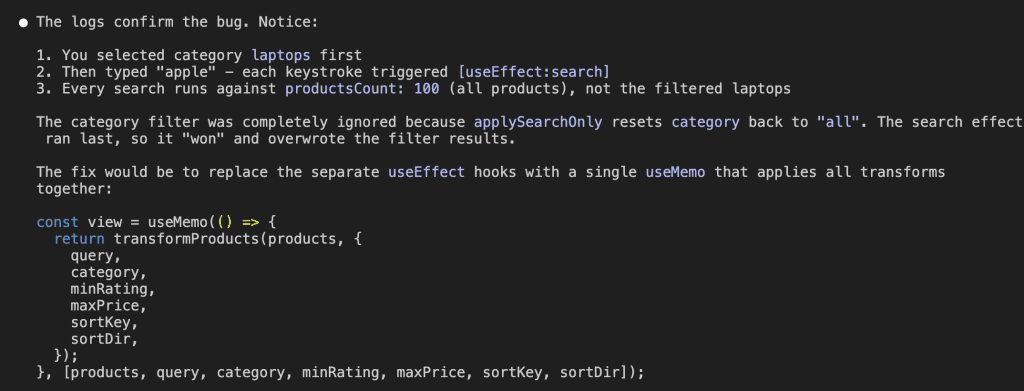
The logs revealed the whole story: when I selected a category, useEffect:filters fired and correctly filtered the products. But then when I typed in the search box, useEffect:search fired—and it ran against the full product list, completely ignoring the category filter.
The search effect was overwriting the filter results.
Last effect wins. (JavaScript, you beautiful chaos gremlin.)
Claude proposed the fix: replace multiple competing useEffect hooks with a single useMemo that applies all transforms together:
const view = useMemo(() => {
  return transformProducts(products, {
    query,
    category,
    minRating,
    maxPrice,
    sortKey,
    sortDir,
  });
}, [products, query, category, minRating, maxPrice, sortKey, sortDir]);
One attempt. Bug fixed.
The difference between “Claude guessing for 20 minutes” and “Claude solving it instantly” was 30 seconds of logging.
That’s not hyperbole. That’s just… math.
.
.
.
Method 2: Map the Problem Before Anyone Tries to Solve It
The second method works for a different beast entirely—the kind of bug where even the error message is lying to you.
Here’s a WordPress error that haunted me for hours:
Deprecated: strpos(): Passing null to parameter #1 ($haystack) of type string
is deprecated in /var/www/html/wp-includes/functions.php on line 7374

Warning: Cannot modify header information - headers already sent by
(output started at /var/www/html/wp-includes/functions.php:7374)
in /var/www/html/wp-includes/option.php on line 1740
If you’ve done any WordPress development, you recognize this particular flavor of suffering.
The error points to core WordPress files—not your code. Something, somewhere, is passing null to a function that expects a string. But where? The error message is about as helpful as a fortune cookie that just says “bad things happened.”
I’d made changes to several theme files.
Any one of them could be the culprit.
And the cascading nature of WordPress hooks meant the error could originate three or four function calls before the actual crash.
After a few rounds of Claude trying random fixes (bless its heart), I tried something completely different.
The Brainstorming Prompt That Changes Everything
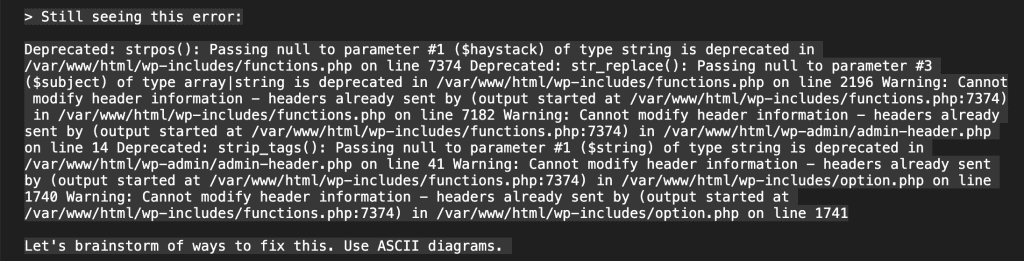
Instead of “fix this,” I asked Claude to brainstorm debugging approaches—and to visualize them with ASCII diagrams.
(I know. ASCII diagrams. In 2025. But stay with me, because this is where Claude Code debugging gets genuinely interesting.)
Claude Maps the Error Chain
Claude started by analyzing the flow of the problem:
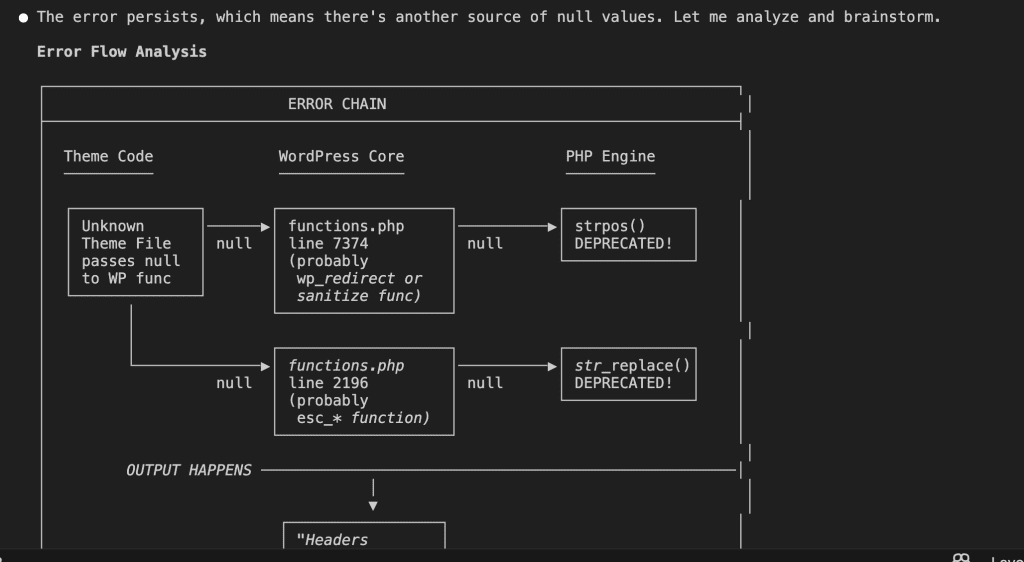
The diagram showed exactly what was happening: some theme code was passing null to WordPress core functions, which then passed that null to PHP string functions, which threw the deprecation warning.
But which theme code? Claude identified the suspect locations:
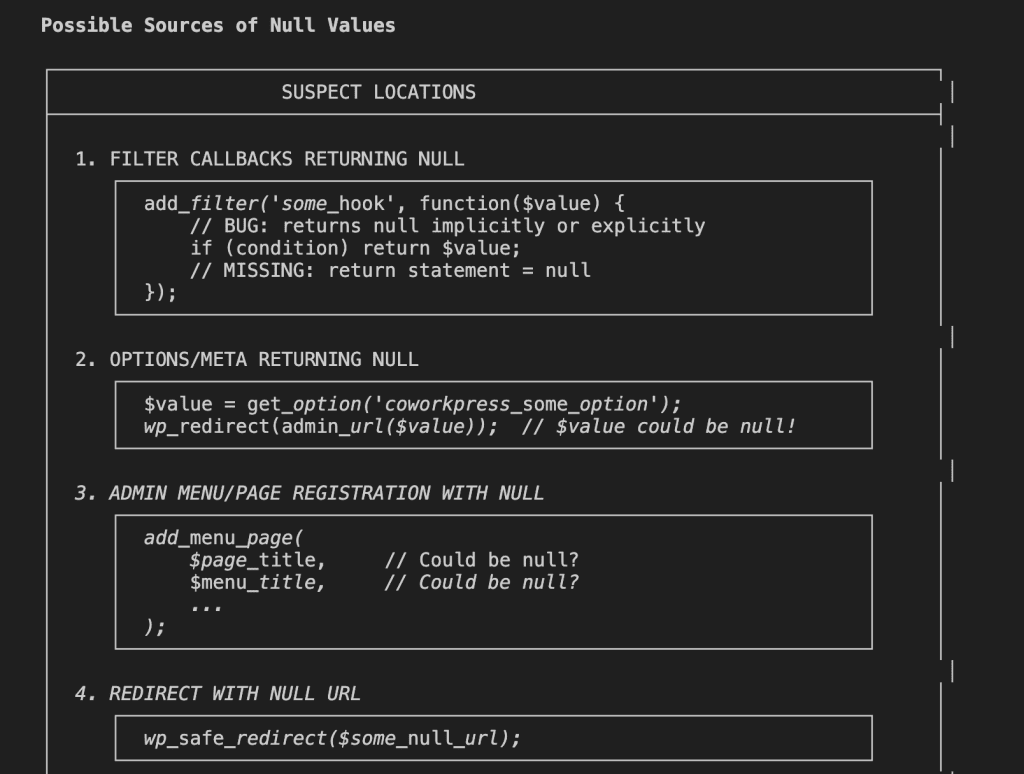
Four possible sources.
Each with code examples showing what the problematic pattern might look like.
This is Claude thinking out loud, visually. And it’s incredibly useful for Claude Code debugging because now we’re not guessing—we’re investigating.
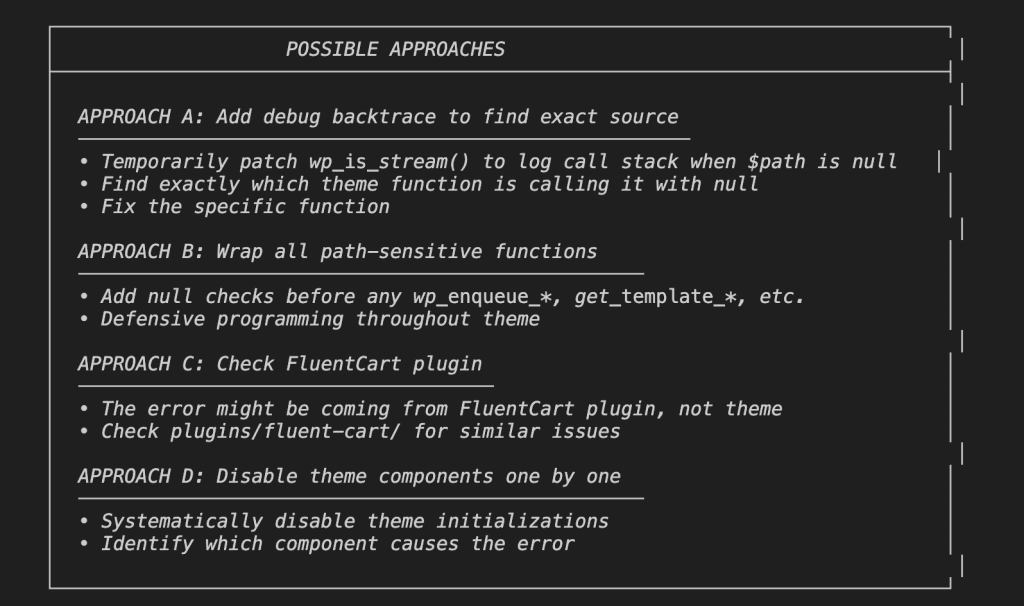
Multiple Debugging Strategies (Not Just One)
Rather than jumping to a single fix and hoping, Claude laid out several approaches:
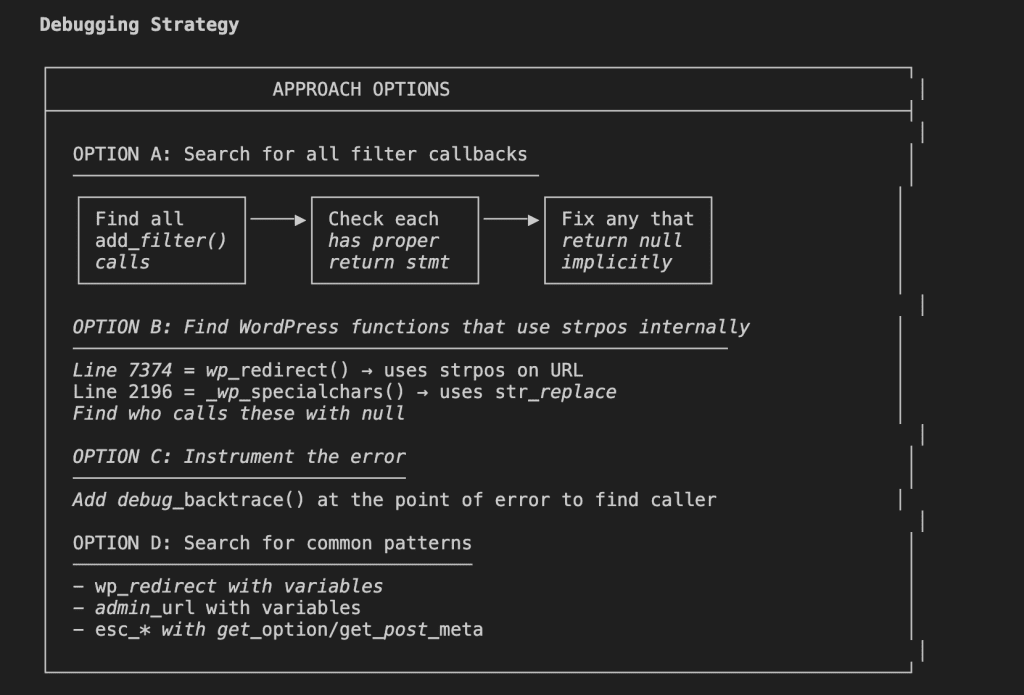
- Option A: Search all filter callbacks for missing return statements.
- Option B: Find which WordPress functions use
strposinternally. - Option C: Add
debug_backtrace()at the error point to trace the caller. - Option D: Search for common patterns like
wp_redirectwith variables.
Four different angles of attack.
This is what systematic debugging looks like—and it’s exactly what you need when you’re stuck in the merry-go-round.
Claude Does Its Homework
Here’s where Opus 4.5 surprised me.
Instead of settling on the first approach, it validated its theories by actually searching the codebase:
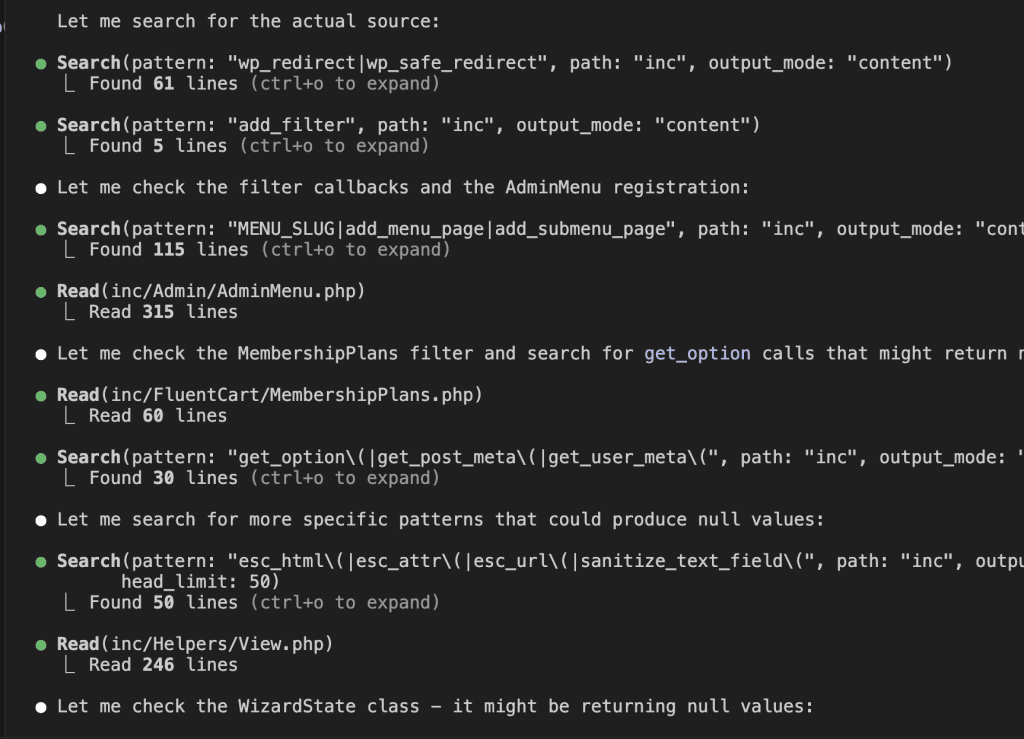
It searched for wp_redirect calls, add_filter patterns, get_option usages—systematically eliminating possibilities like a detective working through a suspect list.
Then it updated its diagnosis based on what it found:
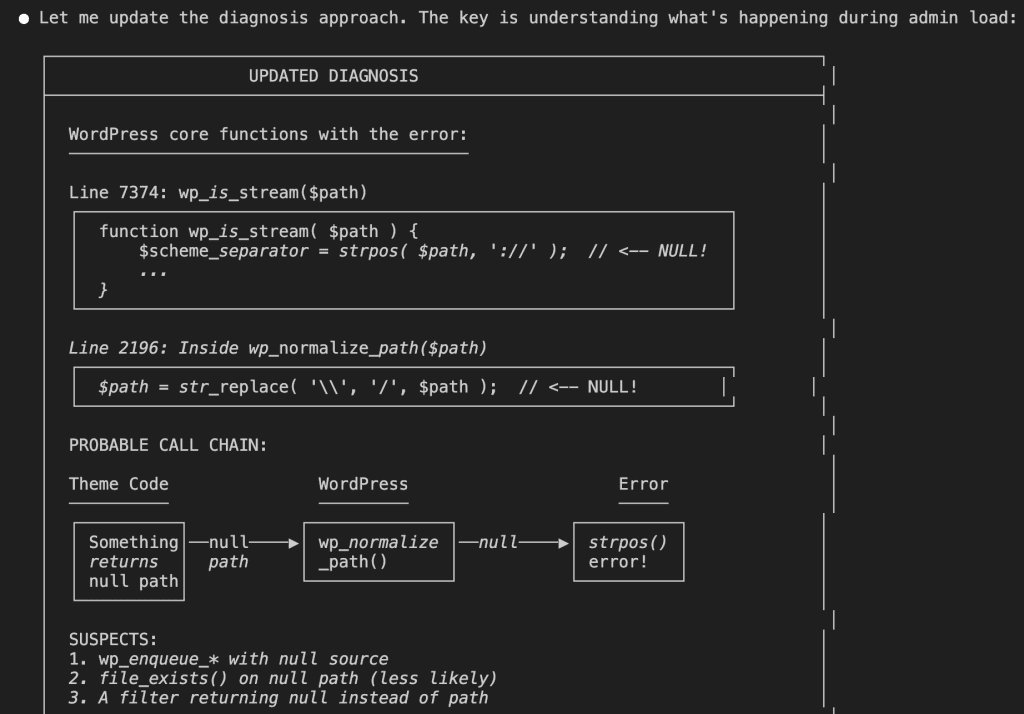
The investigation narrowed.
The error was coming from path-handling functions—something was returning a null path where a string was expected.
The Summary That Actually Leads Somewhere
Claude concluded with a clear summary of everything we now knew:
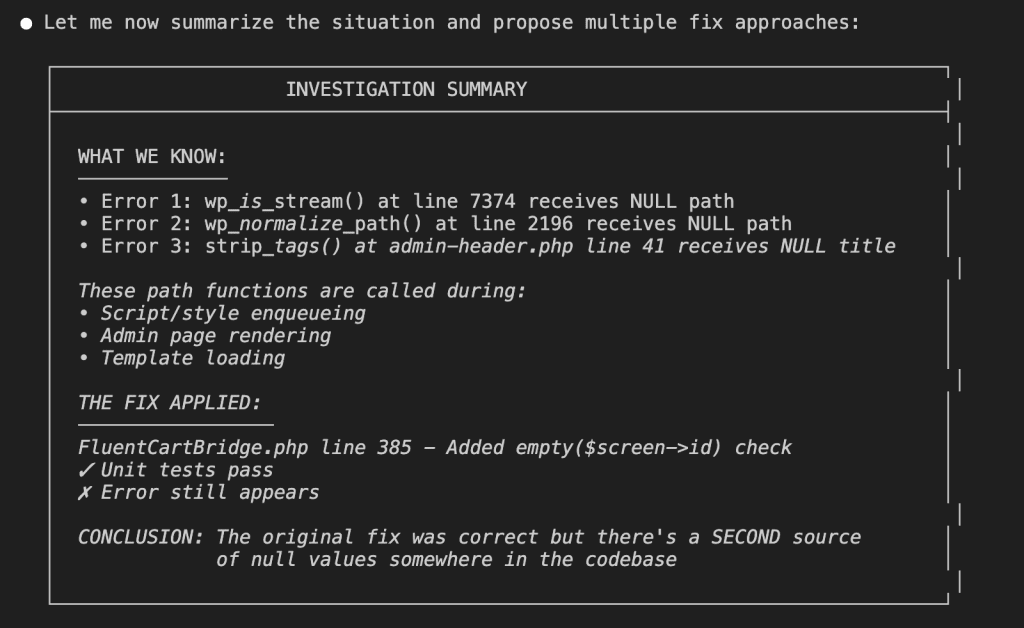
And multiple approaches to fix it, ranked by how surgical they’d be:
Did it work?
First attempt. Approach A—adding a debug backtrace—immediately revealed a function in FluentCartBridge.php that was returning null when $screen->id was empty.
One additional null check.
Bug gone.
All those rounds of failed attempts? They were doomed from the start because Claude was guessing blindly. Once it could see the error chain visually—once it had a map instead of just a destination—the solution was obvious.
.
.
.
Why This Actually Works (The Part Where I Get a Little Philosophical)
Both of these methods work because they address the same fundamental gap in Claude Code debugging: AI doesn’t fail because it’s not smart enough. It fails because it can’t see what you see.
When you’re debugging, you have browser dev tools, console logs, network requests, and actual behavior unfolding on your screen. Claude has code files.
That’s it.
It’s working with incomplete information and filling the gaps with educated guesses.
Here’s the mindset shift that changed everything for me:
👉 Stop expecting AI to figure it out. Start helping AI see what you see.
You become the eyes. AI becomes the analytical brain that processes patterns and proposes solutions based on the evidence you feed it.
It’s a collaboration. A partnership. Not a vending machine where you insert a problem and expect a solution to drop out.
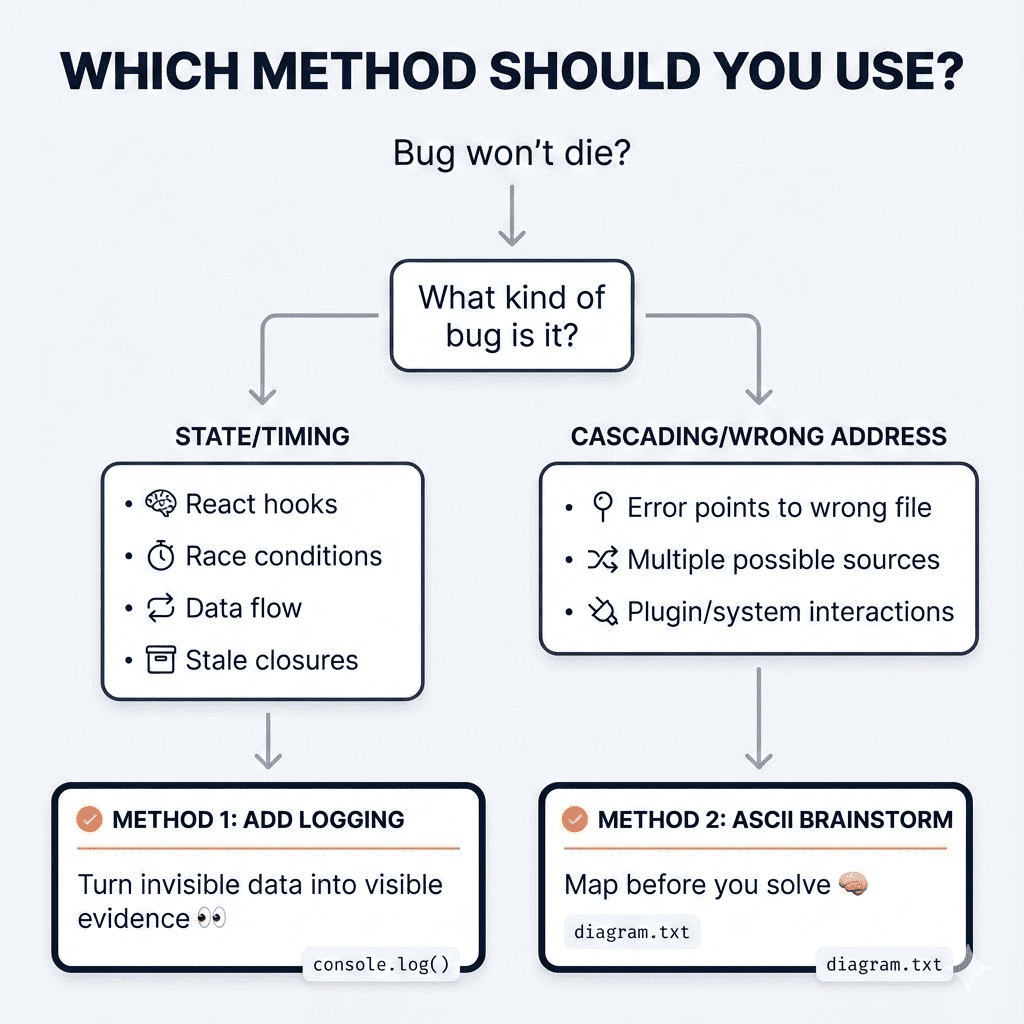
When to Use Logging
Add logs when the bug involves:
- Data flow and state management
- Timing issues and race conditions
- Lifecycle problems in React, Vue, or similar frameworks
- Anything where the sequence of events matters
The logs transform invisible runtime behavior into visible evidence.
React’s useEffect, state updates, and re-renders happen in milliseconds—too fast to trace mentally, but perfectly captured by console.log. Feed those logs to Claude, and suddenly it can see the movie instead of just reading the script.
When to Use ASCII Brainstorming
Use the brainstorming approach when:
- Error messages point to the wrong location
- The bug could originate from multiple places
- You’ve already tried the obvious fixes (twice)
- The problem involves cascading effects across systems
Asking Claude to brainstorm with diagrams forces it to slow down and map the problem systematically. It prevents the merry-go-round where AI keeps trying variations of the same failed approach. By exploring multiple angles first, you often find the root cause on the very first real attempt.
.
.
.
The Line Worth Tattooing Somewhere (Metaphorically)
Here’s what I want you to take away from all of this:
Don’t argue with AI about what it can’t see. Show it.
The next time Claude can’t solve a bug after a few rounds, resist the urge to rephrase your complaint. Don’t add more adjectives. Don’t type in all caps. (I know. I KNOW. But still.)
Instead, ask yourself: “What am I seeing that Claude isn’t?”
Then find a way to bridge that gap—through logs, through diagrams, through screenshots, through any method that gives AI the visibility it needs to actually help you.
.
.
.
Your Next Steps (The Warm and Actionable Version)
For state and timing bugs:
- Pause. Take a breath. Step off the merry-go-round.
- Ask Claude to add logging that tracks the data flow.
- Run your test, copy the console output, paste it back to Claude.
- Watch Claude solve in one shot what it couldn’t guess in twenty.
For complex, cascading bugs:
- Paste the error message (yes, the whole confusing thing).
- Add: “Let’s brainstorm ways to debug this. Use ASCII diagrams.”
- Let Claude map the problem before it tries to solve it.
- Pick the most surgical approach from the options it generates.
That bug that’s been driving you up the wall? The one Claude keeps missing?
Give it eyes.
Then watch it solve what seemed impossible.
You’ve got this. And now Claude does too.
Leave a Comment